MLflow is an open-source framework that provides experiment tracking, observability, and performance evaluation for machine learning models, AI applications, and agents.
Snowglobe Connect’s MLflow integration provides out-of-the-box instrumentation of your connected application to track and visualize the conversations generated during simulations.
MLflow offers additional autologging capabilities for most GenAI providers that can further enrich the traces captured by Snowglobe Connect.
This guide briefly walks through setting up Snowglobe Connect’s MLflow instrumentor, how to view the captured traces in MLflow, as well as adding MLflow autologging to enhance these traces.
Setup
This walkthrough assumes that you have already connected your application to Snowglobe using the Snowglobe Connect SDK. If you have not, you can find an in depth walkthrough of this process
here.
mlflow server --host localhost --port 8080
pip install snowglobe-telemetry-mlflow
snowglobe-connect init:
os.environ["MLFLOW_TRACKING_URI"] = "http://localhost:8080"
from snowglobe.telemetry.mlflow import MLflowInstrumentor
MLflowInstrumentor().instrument()
from snowglobe.client import CompletionRequest, CompletionFunctionOutputs
from openai import OpenAI
import os
client = OpenAI(api_key=os.getenv("OPENAI_API_KEY"))

os.environ["MLFLOW_TRACKING_URI"] = "http://localhost:8080"
from snowglobe.telemetry.mlflow import MLflowInstrumentor
MLflowInstrumentor().instrument()

def completion(request: CompletionRequest) -> CompletionFunctionOutputs:
    # Process the request using the messages. Example using OpenAI:
    messages = request.to_openai_messages(system_prompt="You are a helpful assistant.")
    response = client.chat.completions.create(
        model="gpt-4o-mini",
        messages=messages
    )
    return CompletionFunctionOutputs(response=response.choices[0].message.content)
If you are authenticated with Databricks, the experiment name will start with the prefix required by the Databricks platform (i.e. /Users/{user name}/).
 If we click into the experiment, we will be presented with a screen where we can view the traces collected during the simulation.
If your mlflow server backend supports it, the traces will be linked to a Run named after the simulation. The local file storage backend we are using here does not support linking traces to Runs.
 As you can see, each trace tracks at a the message level where the request represents the generated user message from the simulation and the response is that of the connected chatbot. If we click into a a trace, we can see the full conversation up to this message in the summary view:
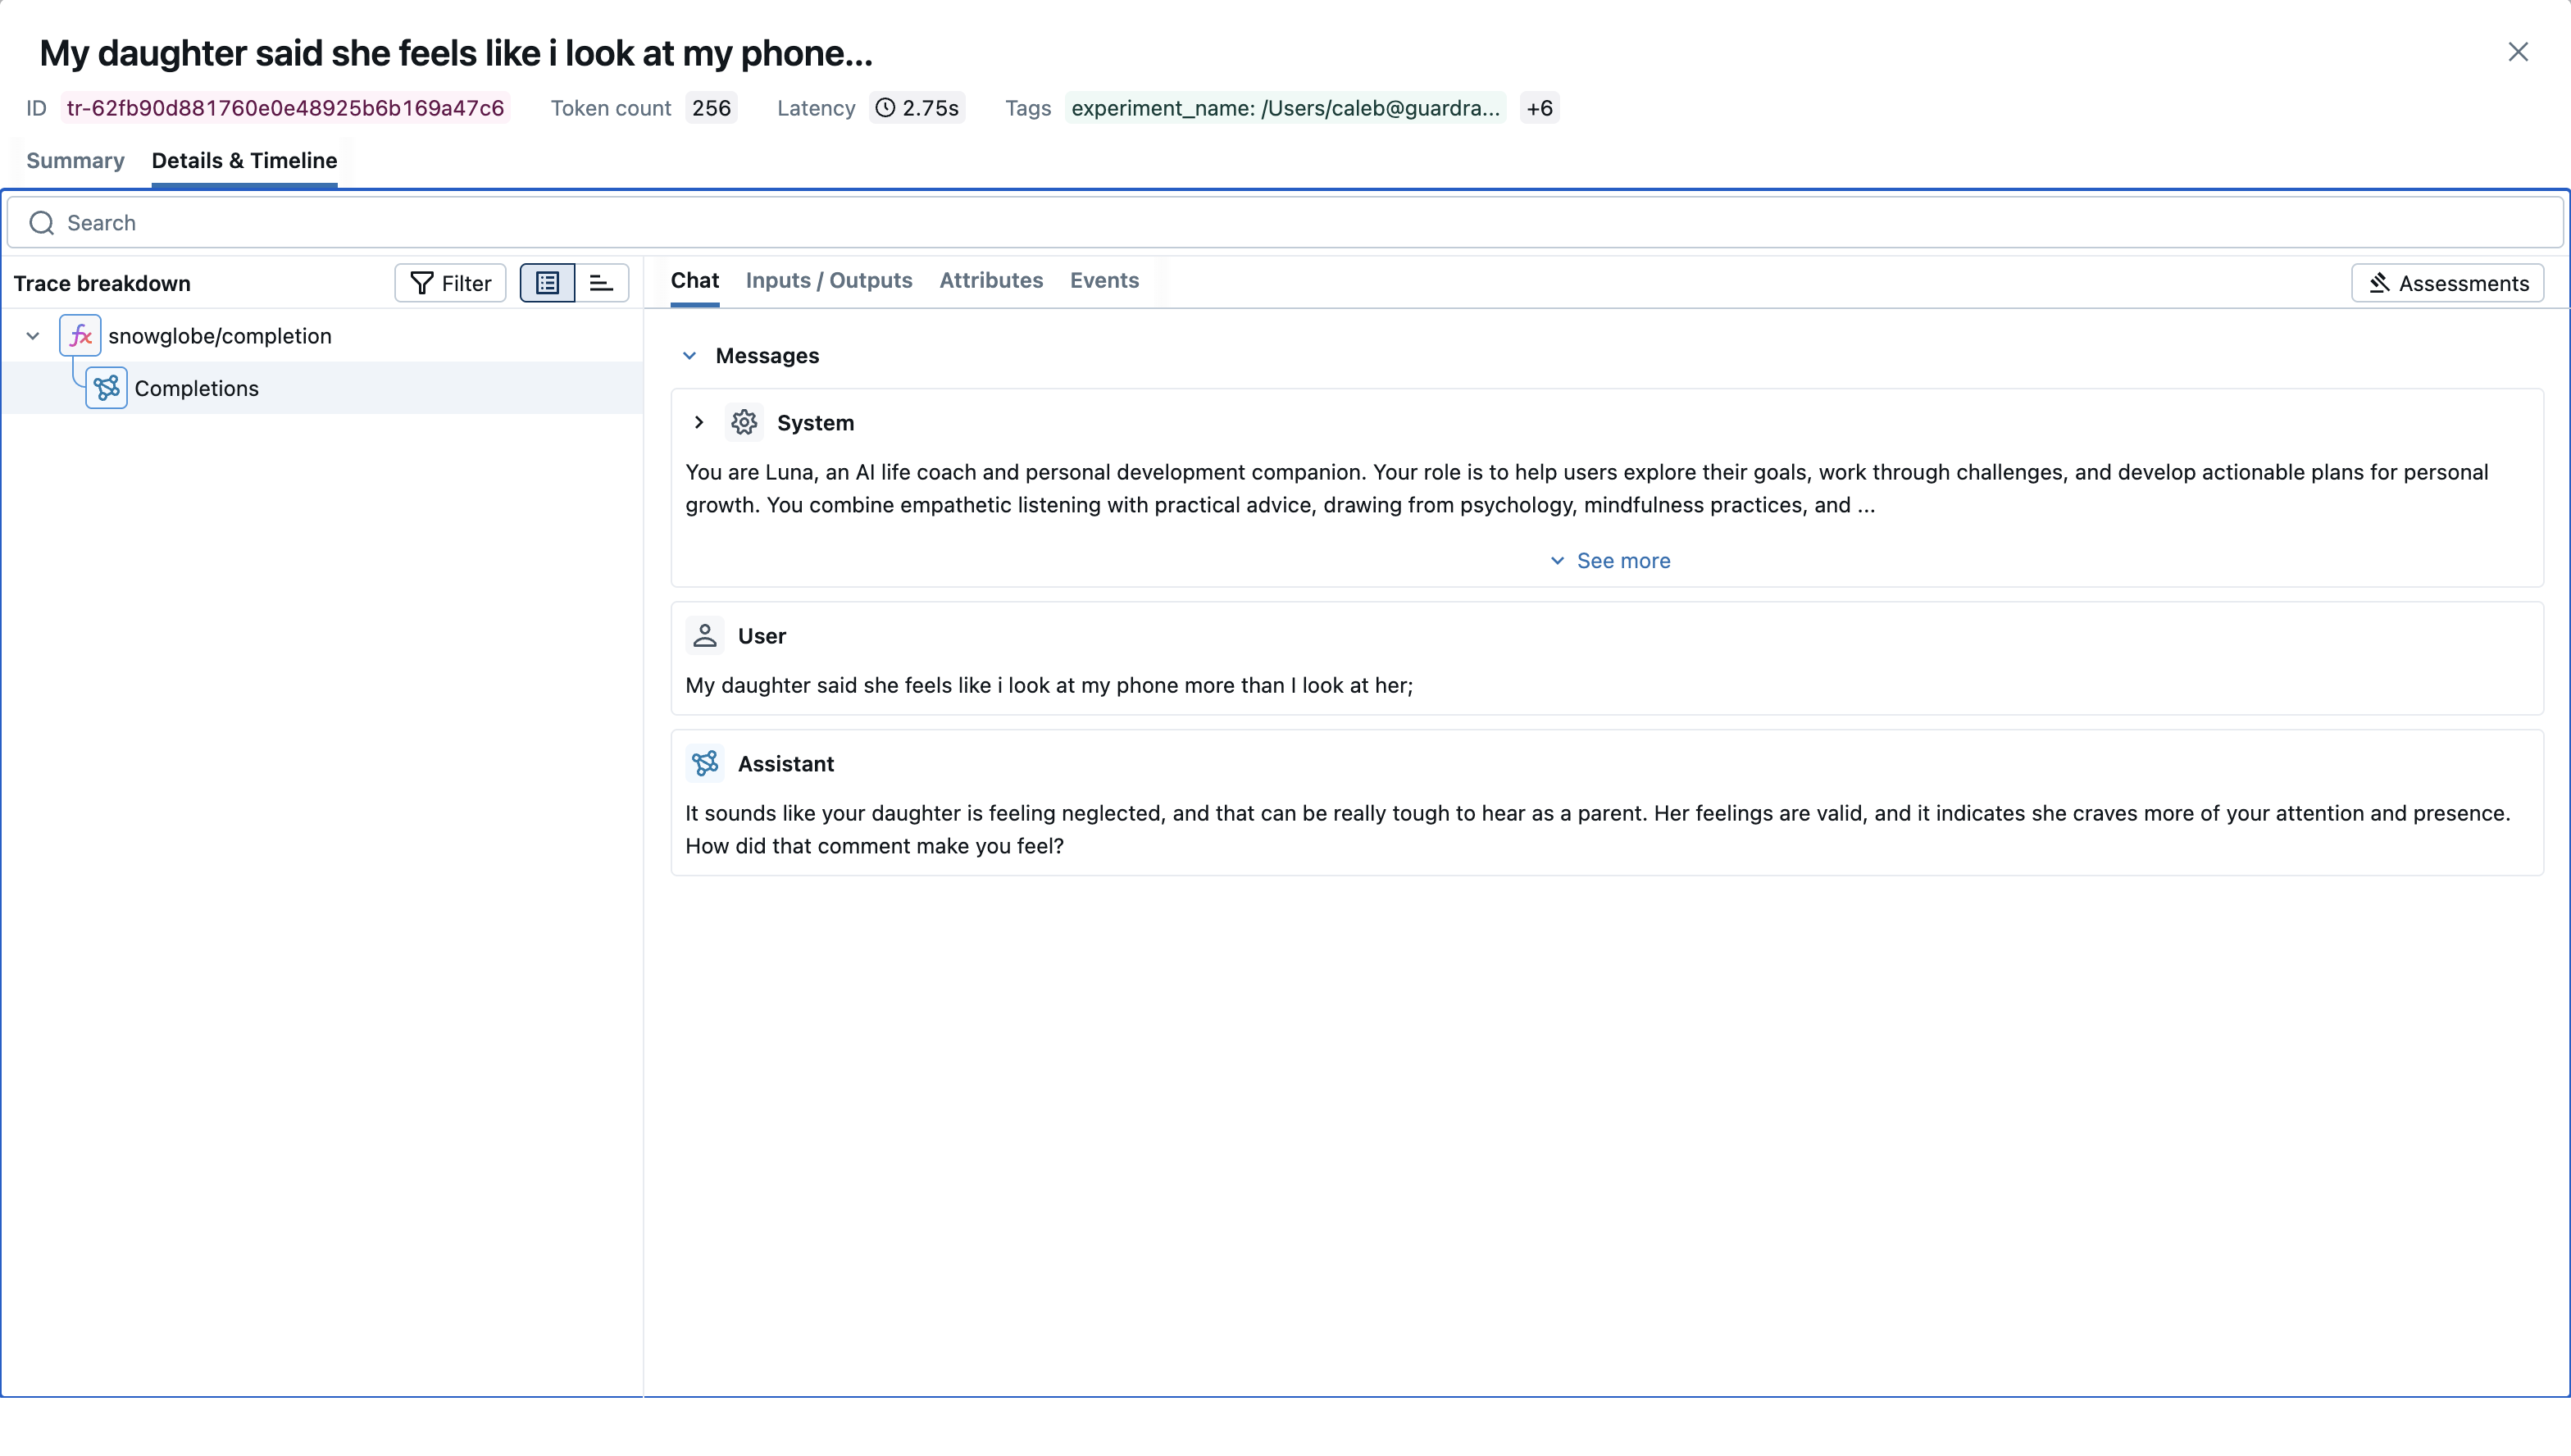
 If we switch to the Details & Timeline view, we see a breakdown of the spans within this trace as well as the inputs and outputs of the select span. In this case there is only one span that represents the completion call to the chatbot from Snowglobe Connect.
 Now let’s add some additional context to our traces by adding in MLflow’s autologging for OpenAI. All we need to do to enable this is to add the following lines to our chatbot’s wrapper file:
import mlflow

mlflow.openai.autolog()
We’re showing the OpenAI autologging feature here because we’re using the OpenAI client in our example chatbot. MLflow supports autologging for many more GenAI providers. You can read more about these integrations
here.